ArrayDebugViewer-Add-In Documentation
Author: Joachim Eibl
Homepage: arraydebugview.sourceforge.net
License: GNU General Public License Version 2
Last update: 2010-04-01
Contents:
Introduction
Installation for VS2005 or VS2008 DLL-version
Installation for VC6
Installation for VS.NET(2003)
Installation for VS2005 VB Macro
Installation of the TransferToArrayDebugViewEEAddIn.dll
Using The ArrayDebugView-Add-In
- Pointer Expression
- Format, Length, Structure, Stride
- Calc-Button, Starting The Data Transfer
- Cursor And Zoom Function
- Saving Data
Hints
- Viewing Arrays Numerically In Visual Studio
- Writing custom visualizers for Visual Studio 2005
Introduction
The Developer Studio Debugger has no graphical capabilities for analyzing
arrays of numbers. The program ArrayDebugViewer is a Developer-Studio-Add-In
that allows to graphically analyze arrays of numbers within the debugger.
Any pointer expression that the debugger understands can be used to specify
the start of the array.
The version ArrayDebugView 1.42 supports VS2005 and VS2008.
ArrayDebugView2_1.30 supports VS.NET(2003).
1.22 supports MS-Visual-Studio 6.
For VS2005 and VS2008 VB-macros (1.30) also exist but are not recommended anymore.
Only debugging C/C++-programs is supported.
Installation for VS2005 or VS2008 DLL-version
- You need the file ArrayDebugView_1.42.zip.
- Unpack it and move the contents to any folder you want. (See also the Readme.txt in the package.)
- Close all running instances of Visual Studio 2005, 2008 or newer.
- Register by executing the file RegisterArrayDebugView.bat. (Should report successful registration.)
- Launch Visual Studio 2005 or 2008.
- Menu "Tools" should contain "ArrayDebugView" at the top.
- Choose that to open the dialog.
- This might even work for VS2010 but is not tested at the time of writing.
Installation for VC6
You need the file ArrayDebugViewAddIn.dll (provided by a binary package or
compiled locally).
Where to place the Add-In:
Copy the file into the add-in directory of your Visual-Studio-Installation:
...\Programs\Microsoft Visual Studio\Common\MSDev98\AddIns
Other locations are also possible, but in this directory Visual-Studio finds
add-ins automatically.
How to activate the Add-In:
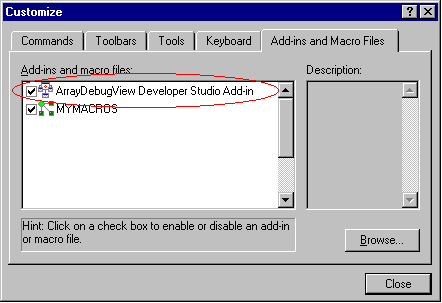
In Visual-Studio: Menu "Tools/Customize..." opens the "Customize"-window.
Then select the tab "Add-ins and Macro Files".

If the add-in doesn't appear in the list, you can use "Browse..." to search
for the file manually. (Select the file type "Add-ins (.dll)" in the browser,
or DLLs will not be shown.)
Only if the add-in is activated, it will also be loaded. (See the picture.)
When closing the "Customize"-window a small window with a button icon appears:

You might want to drop it in the button bar. Should you accidentally "loose"
the button, you can restore it: First open the "Customize"-window again,
disable the add-in, close the "Customize"-window, reopen it again, activate
the add-in and close the "Customize"-window again. Now the small window with
the icon should reappear.
Installation for VS.NET(2003)
Download the file ArrayDebugView2Setup_1.30.msi.
Before installing make sure VS.NET is not running.
Start the installation (e.g. doubleclick on the msi-file).
After the installation is complete run VS.NET and check if the Tools-menu contains an entry ArrayDebugView. (If not, also check other menus like the Extra-menu.)
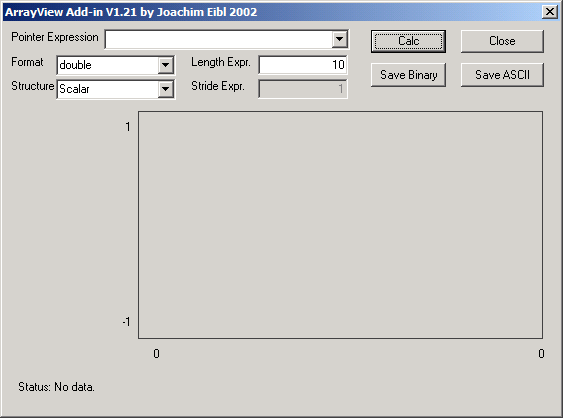
If you have that menu-entry, click it to get the dialog below.
Note: Add-Ins for VS.NET are much more complicated to install. If the add-in works for you, consider yourself lucky.
On some systems the menu-item contains no icon (which is no real problem). On other system the menubar doesn't appear at all. Or the entry isn't there anymore after exiting and restarting VS.NET. I didn't find enough information to solve all installation-problems reliably. If you know how to fix such problems you're welcome to help.
If you want to reinstall because VS.NET was running during the installation and the menu-entry isn't there, or if you've lost the menu-entry somehow, please first close VS.NET, then uninstall the ArrayDebugView2. Now start VS.NET and exit it again. Finally rerun the installation of ArrayDebugView2. If you think it's odd to have to start and exit VS.NET before reinstalling, so do I, but otherwise it won't work.
The msi-file also puts the TransferToArrayDebugViewEEAddin.dll in the directory where you installed. But this is not enough to use the fast data transfer. Please read on here on how to install and use it.
Installation for VS2005 VB-Macro version
Download the file ArrayDebugView_for_VS2005_1.30.zip and unpack it somewhere.
The package contains the file ArrayDebugView.vb. It contains a Visual Studio macro. To install it:
- In Visual Studio 2005 choose menu "Tools" -> "Macros" -> "Macros IDE ..."
- In the Macros IDE - Project Explorer (on the left)
right-click "MyMacros" and choose "Add"->"Add existing item", choose the file ArrayDebugView.vb
from this package.
- Right-click "References" in the Project Explorer and "Add References ...": Add "System.Drawing.dll"
- In the menu "View" choose "Error List": Now no errors should remain.
- Save, then (optionally) close the Macros IDE
- To access it via a menu entry in the normal Visual Studio IDE choose menu "Tools" -> "Customize" and in tab "Commands" choose the category "Macros" on the left side and on the right side choose
"Macros.MyMacros.ArrayDebugView.Main" and drag it into the toolbar or a menu of your
choice. (e.g. "Tools")
Note that sometimes the macro doesn't immediately pop up, but appears minimized in the task bar. Click on the entry in the task bar then. But if there is no entry and not even an error appears when running, then check if the Service Pack 1 for Visual Studio 2005 is correctly installed. Then please install that (again)!
The zip-file also contains the TransferToArrayDebugViewEEAddin.dll. Please read the next section on how to install and use it. (Slow data transfer will still work without that dll.)
For High Speed Data Transfer: Installing the TransferToArrayDebugViewEEAddIn.dll
Note for ArrayDebugView_1.42 the fast data transfer should just work for local 32-bit-processes.
The following applies only for older versions of ArrayDebugView or if the standard method (via ReadProcessMemory) fails. (e.g. Remote Debugging)
When viewing big arrays the slow data transfer will take too long. In order to use the fast data transfer the following requirements must be met:
- The TransferToArrayDebugViewEEAddin.dll must be copied where the devenv.exe is.
(e.g. C:\Program Files\Microsoft Visual Studio 8\Common7\IDE)
- The autoexp.dat file (C:\Program Files\Microsoft Visual Studio 8\Common7\Packages\Debugger\autoexp.dat)
must contain this line in the [AutoExpand]-section of the file:
TransferToArrayDebugView=$ADDIN(TransferToArrayDebugViewEEAddin.dll,_TransferToArrayDebugView@28)
- The program you debug must know about the structure TransferToArrayDebugView.
Place this code in a common header file of your project (e.g. stdafx.h):
struct TransferToArrayDebugView{ int dummy; };
static TransferToArrayDebugView __transferToArrayDebugViewDummy;
- Use ArrayDebugView 1.30 (for VS.NET2003 or VS2005).
Only for data transfers above 50000 bytes an error message appears if the fast data transfer is not possible. You can then abort or proceed with the slow mode. Below that limit ArrayDebugView will silently fall back to the slow transfer technique if the fast transfer fails.
How it works:
The normal ArrayDebugView Add-in or macro use the debugging COM-interface of Visual Studio. This interface allows to evaluate expressions, such as you can look at in one line of the watch window. To transfer arrays ArrayDebugView calls this function many times which is slow.
Until recently I didn't know that another much faster way to access memory from the debugger existed. It works via the autoexp.dat-file. When starting a debugging session Visual Studio uses the type-specific instructions to display data in the watch window. For complex types it will even load a expression evaluator dll and lets it create a string for the one-line watch output. This is not that exciting, except for the fact that the dll has fast read access to the memory of the debugged program.
With some tricks this is even usable for the ArrayDebugView macro. A normal expression evaluator would only read the data associated with a given structure and therefore also knows how many bytes to read. Since we don't want to put our data in a specific type and thus restrict us, we only use a dummy data type TransferToArrayDebugView and when accessing it, ArrayDebugView just casts our pointer to that type. This will invoke our expression evaluator. The amount of data and a filename where to place it is communicated via registry entries. The string result of the expression evaluator is only used as status info.
This explains why you need the dummy structures in your program. Visual Studio must know it in the debug information, so it can do the cast when ArrayDebugView wants to evaluate an expression.
Using The ArrayDebugView-Add-In
Selecting the ArrayDebugView-item in the Tools-menu (or for VC6 a click on the icon) opens the dialog of the ArrayDebugViewer.

Pointer Expression
You can specify any expression that is understood by Visual Studio and can
be used as a pointer. The actual pointer type does not matter. (E.g. even
a void* is valid.) I usually test my expressions in the watch window
and use copy and paste to transfer complicated expressions to the add-in.
Note that you actually can use any expression, which results in a number
in the watch-window. This includes integers that, when interpreted as pointers,
point to valid memory positions. Also formulas that contain several variables
of the debugged program can be used.
Examples: (Assume that p is a pointer of some type.)
&p[634]
p+34*sizeof(double)
p+x*y*z
pStruc->m_pData
The first example shows how you can start at a certain position. This can
be useful if you have lots of data but are only interested in a small section.
Old Expressions
Note that old expressions will not be lost. The pointer-expression entry
field is a combo box that remembers the last 10 expressions and the parameters
for the individual expression! These values will be stored on disk, so that
the expressions you use most often, will not be lost.
Format, Length, Structure,
Stride
Select the type via "Format". Possibilities are:
- double
- float
- signed int
- unsigned int
- signed short
- unsigned short
- signed char
- unsigned char
Specify the length of the array via "Length Expr.". The length is the number
of values that should be read (not a memory size in bytes). You may again
use any expression that is understood by the debugger and that results in
a number.
Via "Structure" you can choose one of the following:
- Scalar: The values in the array follow one after the other.
- Complex, Real: Complex arrays consist of value pairs. The real component
is the any value with even index.
- Complex, Imag: The imaginary component of a complex number at the odd
indices.
- Complex, Abs: sqrt( re*re + im*im )
- Stride (elements): Specify a stride in elements.
- Stride (bytes): The stride can be specified in bytes.
If you choose "Stride (elements)" or "Stride (bytes)" then the "Stride Expr."-Field
will become active and you can specify a stride-value. (Again any expression
is possible.)
Examples:
With "Stride (elements)": Stride=1 behaves like "Scalar", Stride=2 behaves
like "Complex, Real".
If you have an array of structures like:
struct COORD { double x; double y; double z; };
COORD* pCoord;
In order to view all z-Values, specify Stride=3 and the pointer-expression
"&pCoord->z".
But note that the add-in assumes a packed alignment for this to work. Consider
the next example:
struct MISC { double d; int i; char c; };
MISC* pMisc;
In order to view all i-values, specify the pointer expression "&pMisc->i",
format "signed int", structure "Stride (bytes)" and the stride expression
"sizeof(*pMisc)".
This is safe because it works for any alignment.
Note on alignments: The size of any structure is not always the sum
of the sizes of its individual members. But the compiler might add some padding
bytes depending on the alignment. In Visual C possible alignment values are
1, 2, 4, 8 and 16. E.g.: for alignment=1 sizeof(MISC)=13 while for alignment=4
the sizeof(MISC)=16.
Calc-Button, Starting
The Data-Transfer
Only when you click the "Calc"-button (or press Enter or Return) then the
data from the debugged program will be transferred and plotted.
(For old versions or if fast transfer fails then a messagebox will ask if you want to proceed with slow transfer mode. Then the status line at the
bottom of the dialog then shows the progress. While data is transferred,
no other interaction is possible. You might want to avoid this for large arrays >10000 elements.)
The status line also shows errors that occurred, like if an expression can't
be handled, or if the address points to memory that doesn't belong to the
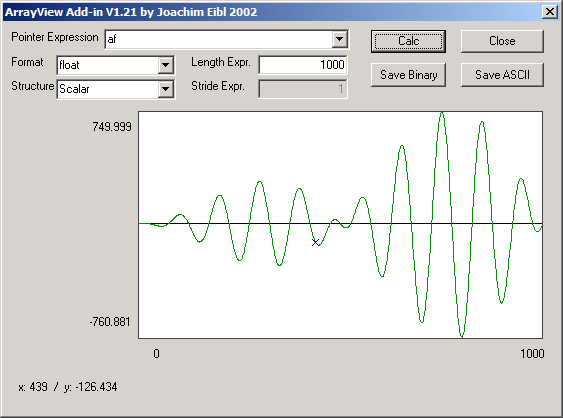
debugged program. After a successful transfer the output might look like
this:

Cursor And Zoom Function
When you move the mouse over the plot-area, a small "x"-cursor appears on
the curve. The status line then shows the corresponding coordinates.
In order to zoom in, you can select a range with the left mouse button. Click
the first point and hold the button while moving the mouse. A rectangle appears
that selects the new range. When you release the mouse button the selected
range will be magnified.
To zoom out, click the right mouse button anywhere inside the plot-area.
Saving Data
The buttons "Save Binary" and "Save Ascii" allow to save the data. A "Save
As"-Dialog will appear, where you can specify a filename.
When saving as ascii the plotted values will be saved as a list of numbers,
each in its own line.
Saving as binary in the current version saves all the transferred memory,
i.e. also the data in-between for structure complex or stride.
Hints
- Saving as binary might be useful, if the data can be analyzed with
another program, e.g. an text editor etc. (Select format="signed char", structure="Scalar"
and specify the length in bytes. Ignore what is plotted.)
- When saving complex numbers as text, you can either save the real part
or the imag part. If you need both, choose structure="Scalar" and double
the length. In an editor that shows line numbers (starting with 1) you can
say that odd line numbers correspond to the real parts, while even line numbers
correspond to the imag part.
- If you don't need the visualization via ArrayDebugView and only want to
save the memory, you can set the number of bytes and filename in the registry yourself and
place (TransferToArrayDebugView*)pYourPointer in the watch window. The file will be rewritten when running into a breakpoint where your pointer is valid. This requires the TransferToArrayDebugViewEEAddin.dll installed.
(Registry keys: HKEY_CURRENT_USER\Software\JoachimEiblsTools\ArrayDebugView\Filename (String),
HKEY_CURRENT_USER\Software\JoachimEiblsTools\ArrayDebugView\LengthInBytes (DWORD))
Viewing Arrays Numerically
In Visual Studio
To view the arrays numerically you don't even need an add-in. Just specify
the pointer-expression followed by a comma and the length.
Examples:
p,20
((double*)pInt),100
Writing custom visualizers for Visual Studio 2005
Some very interesting information about writing your own visualizers for VS2005 can be found
here.
